Two commercial charging sites can have identical hardware, identical traffic, and identical install costs, and still land five years apart on payback. The difference is almost always the electricity tariff. It is the longest-lived input in the model, it compounds every month for the life of the site, and it is the one line most operators copy from a neighbor's project instead of reading off their own utility's filed schedule.
This guide is about reading that schedule. It walks the anatomy of a commercial EV tariff sheet line by line, then maps each line to a specific input in the commercial ROI snapshot so you can turn a dense rate document into a credible pro forma. It pairs with Building a Realistic ROI Model (the Level 2 framework) and DC Fast Charging ROI (where demand charges dominate the math); read whichever matches your site, then come back here when you have an actual tariff sheet in front of you.
A commercial electricity bill is not one number. It is a stack of separate charges, and for an EV charging site the two that matter most pull in opposite directions:
- The energy charge (per kWh) scales with how much you sell. More sessions, more energy, more revenue, more energy cost. It is roughly proportional and easy to reason about.
- The demand charge (per kW of peak draw) scales with your worst fifteen minutes of the month, not your volume. A site that sells very little energy can still get a large demand bill if a few fast chargers happen to run at once. This is the line that turns a "profitable" spreadsheet negative, and it is the line EV-specific tariffs are designed to relieve.
Because the demand charge is driven by peak power rather than energy sold, it behaves worst exactly when utilization is low, which is exactly where most new sites start. That is why the same hardware can pencil in one utility territory and fail in another: not because the energy rate differs by a cent or two, but because one utility bills demand at twenty-five dollars per kW per month and the next offers an EV rate that removes the demand charge entirely.
Get this line right and the rest of the model is arithmetic. Get it wrong and no amount of utilization optimism saves the project.
The anatomy of a commercial EV tariff
Open your utility's commercial rate schedule (often called General Service, General Service Demand, or a named EV rate) and you will find some combination of the following lines. Not every tariff has all of them, and the names vary by utility, but the structure is consistent.
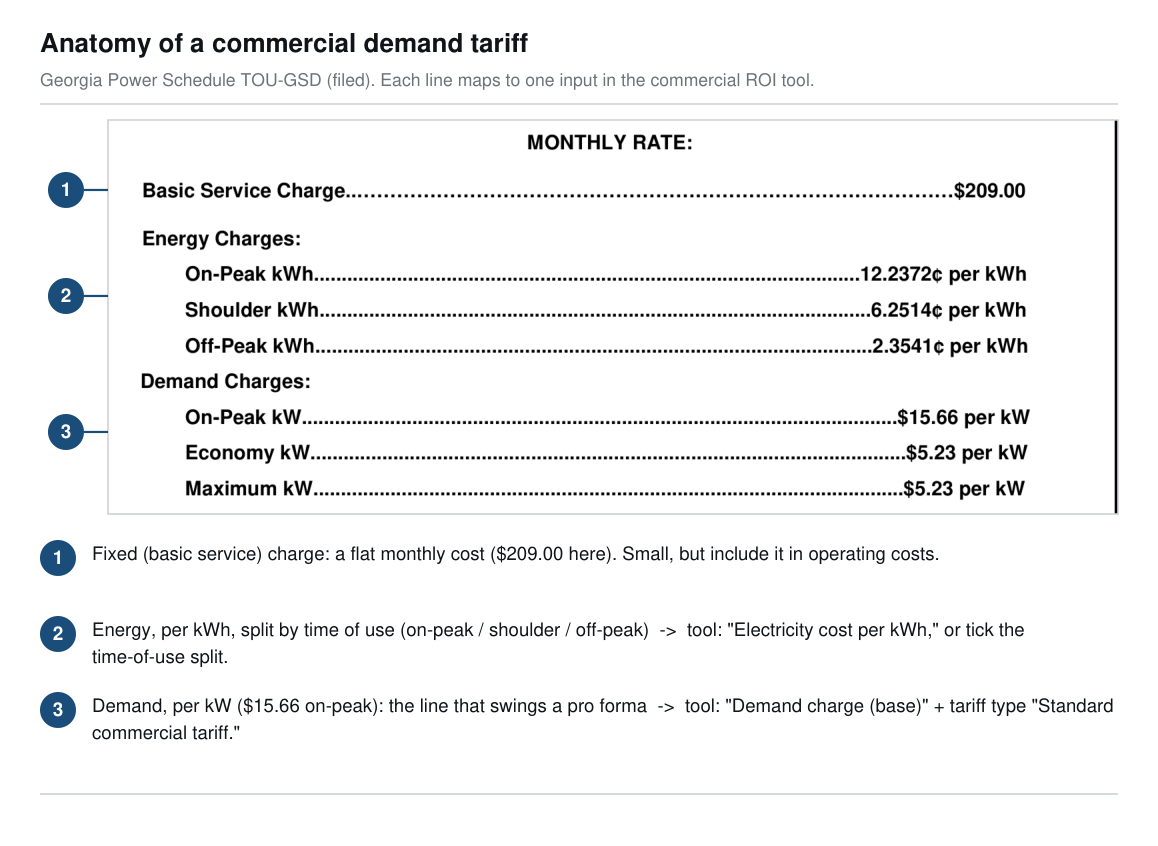
A real commercial demand schedule, line by line. Source: Georgia Power Schedule TOU-GSD (excerpt). Printed rates carry rider adders, so confirm the current revision before modeling.
Fixed or customer charge
A flat monthly amount you pay regardless of usage, sometimes called the basic service charge, customer charge, or basic facilities charge. It covers metering and account costs and typically runs from a few dollars to a few hundred dollars a month depending on service size and voltage. It is small relative to energy and demand for any real charging site, but note it so your operating costs are complete.
Energy charge (per kWh)
What you pay for the electricity itself, in cents per kWh. On a simple rate this is one number. On most commercial and nearly all EV rates it is split by time of use (see below). This is the line that scales with how much energy you deliver, so it is the one you multiply against your projected kWh.
Time-of-use periods and seasons
Commercial EV rates almost always price energy by when it is used. Expect:
- Peak (highest priced), usually a weekday late-afternoon-to-evening window.
- Off-peak (lowest, or close to it), usually overnight and, on many EV rates, midday.
- Part-peak or mid-peak on some tariffs, a middle tier on the shoulders of the peak window.
- Super-off-peak on some tariffs, a deeply discounted block (often midday or deep overnight) meant to pull charging into low-demand hours.
- Seasons: many tariffs split summer and winter, with different prices and sometimes different window hours. The months vary, and not every rate is seasonal: Georgia Power's TOU-GSD summer runs June through September, SDG&E's EV-HP summer runs June through October, and PG&E's BEV has no seasonal variation at all.
The practical takeaway: a depot or multifamily site that charges overnight will pay a very different blended energy rate than a workplace or retail site that charges midday, even on the identical tariff. Your load shape, not just the rate, sets your energy cost.
Demand charge (per kW)
A monthly charge based on your highest measured power draw during the billing period, in dollars per kW per month. Standard commercial demand charges commonly run from about five to twenty-five dollars per kW per month, and some large-service or peak-period rates run higher still (verify your own; the range is wide and seasonal). Three details on the sheet change the bill materially:
- What demand is measured. Usually the single highest fifteen-minute (sometimes thirty-minute) average kW in the month. One coincident spike sets the charge for the whole month.
- Season and time-of-use demand. Many tariffs charge a higher demand rate in summer, and some bill an additional "on-peak demand" charge only for peak draw during peak hours, on top of a facilities demand charge that applies anytime.
- Ratchets. Some tariffs set your billed demand to a percentage (often 75 to 95 percent) of your highest demand over the trailing eleven or twelve months. A single summer spike can then inflate your demand bill for a year. Ratchets are common on larger general-service schedules and are easy to miss.
The subscription alternative (per kW, in blocks)
A growing number of utilities now offer EV rates that remove the conventional demand charge and replace it with a fixed monthly subscription: you reserve a level of capacity, sold in blocks (for example 10 kW, 25 kW, or 50 kW), and pay a set price per block per month no matter how hard you draw within it. The point is predictability: your largest cost line stops swinging with a single spike. This is the mechanism behind California's main EV rates and a handful of others. When you see "subscription," "subscribed demand," or "capacity blocks" on a sheet, you are looking at a demand-charge replacement, not an add-on.
Riders, adjustments, and add-ons
Below the headline rates, tariffs carry riders and adjustment factors: fuel or energy cost adjustments, franchise fees, low-income or public-purpose surcharges, and on EV rates sometimes a billing-demand adjustment that phases in over time. These usually move the bill by single-digit percentages, but they are real. The relevant ones for an EV rate are any that change the demand treatment, for example a billing-demand adjustment factor that suppresses demand while a site ramps.
Once you can name the lines, mapping them into the commercial ROI snapshot is direct. The tool's relevant inputs and what to feed them:
- Energy charge to "Electricity cost per kWh." If your rate is flat, enter the per-kWh number. If it is time-of-use and you want the precision, tick "Model a time-of-use energy rate instead" and fill Off-peak rate, Peak rate, and Percent charged off-peak (your load shape: high for overnight depots and multifamily, low for midday workplace and retail). The tool blends them into one effective energy rate.
- Demand charge to the "Demand charges and tariff" section. This is where the tariff sheet does the most damage or the most good. Set Utility tariff type first, because it decides how the tool treats the demand line, then set the dollar figures:
- Standard commercial tariff (full demand charges): enter your per-kW figure in Demand charge (base) and set the Coincident peak factor (the share of nameplate kW that actually peaks together; the tool suggests a research-backed default by port count).
- EV-specific commercial tariff (reduced demand charges): for rates that lower, but do not eliminate, demand. The tool applies a representative reduction (roughly 65 percent, the midpoint of the range these rates fall in) to your base figure.
- No demand charges (energy-only or subscription rate): for the California EV trio and similar. This zeros the demand line. If your rate bills a subscription in place of demand, enter that monthly total in Monthly subscription charge (price per block times number of blocks you reserve). For a true energy-only rate with no subscription, leave it at zero.
- Demand-charge holiday (phases in later): for rates that waive or suppress demand early and ramp it in as the site gets busy.
- The "Find my utility's EV rate" picker. Inside that same section, the tool lists common utility EV rates and, for each, tells you the mechanism and sets the matching tariff type for you. It deliberately does not fill in a dollar amount, because those are seasonal, size-specific, and change; you still read the number off your own schedule.
The pattern for every example below is the same: read the mechanism off the sheet, pick the tariff type that matches it, then enter your own current dollar figures.
Rate numbers move. The figures below were read from each utility's filed schedule or published rate materials (dated where it matters) and are shown to illustrate the mechanism, not as numbers to paste into your model. A tariff can be refiled between when you read this and when you energize your site, so always pull the current numbers off your own filed schedule for your service voltage and size, and confirm the schedule that will be in effect on your in-service date. Each example links its source sheet, which opens in a new tab.
SCE TOU-EV-7 / 8 / 9 (energy-only during a demand-charge holiday)
Southern California Edison's separately-metered commercial EV rates split by size: TOU-EV-7 (maximum demand 20 kW or less), TOU-EV-8 (above 20 kW up to 500 kW), and TOU-EV-9 (above 500 kW). The rate fact sheet lists three charges: a monthly customer charge, time-of-use energy charges, and a Facilities-Related Demand (FRD) charge. The FRD charge has been waived during a multi-year holiday (the published fact sheet shows it as not applicable across a 2019 to 2023 window), and the timeline has been revisited since, so the rate functions as energy-only today while the demand line is scheduled to return. Confirm whether an FRD charge applies on your in-service date.
- On the sheet, look for: the monthly customer charge, the time-of-use energy table (peak, mid-peak, off-peak, and a winter super-off-peak), and the Facilities-Related Demand line, which may be shown as waived.
- In the tool, set: if the FRD charge is currently waived for your service, Utility tariff type to No demand charges with Monthly subscription charge at 0 (this is energy-only, not a subscription rate). If FRD has phased back in, enter it in Demand charge (base) and choose Standard or EV-specific to match. Use the time-of-use energy fields either way.
- Watch out for: assuming the holiday is permanent. The FRD waiver runs on a schedule, so a site with a long economic life should model a sensitivity case with the demand charge added back.
SDG&E EV-HP (subscription rate, with the discount sunsetting)
San Diego Gas and Electric's EV-HP (Electric Vehicle, High Power) rate, approved in CPUC Decision D.20-12-023 (Application A.19-07-006), bills capacity as a fixed monthly subscription instead of a conventional demand charge: fleets subscribe in 10 kW increments up to 150 kW and in 25 kW increments above 150 kW. On the filed schedule effective October 1, 2025, the subscription runs $48.08 per 10 kW block and $120.20 per 25 kW block at secondary voltage (both about $4.81 per kW). The energy charge is time-of-use (peak 4 to 9 p.m., with off-peak and super-off-peak windows) and seasonal, with summer running June through October. The introductory discount runs 2022 through 2031 and steps up every year toward SDG&E's standard commercial rate (AL-TOU) in 2032, so the subscription rises annually. One catch the program page does not advertise: as the discount sunsets, a demand charge has begun to reappear. The same October 2025 schedule shows standard EV-HP carrying a $7.24 per kW summer maximum on-peak demand charge (secondary), while the EV-HP-CPP variant keeps demand at zero but adds a $2.37 per kW capacity reservation charge and exposes you to critical-peak event pricing.
- On the sheet, look for: the subscription charge stated per block of subscribed kW, the basic service fee, and, increasingly, a residual summer on-peak demand charge. Exceeding your subscribed level for several consecutive months moves you up a level rather than charging a one-time penalty.
- In the tool, set: Utility tariff type to No demand charges, and enter your monthly subscription total in Monthly subscription charge (per-block price times the blocks you reserve, rounding your peak up to the block size; blocks are 10 kW up to 150 kW and 25 kW above). Because standard EV-HP has begun layering a summer on-peak demand charge back on, treat the no-demand result as a floor, or model the EV-HP-CPP variant, which is the closer match to a clean no-demand rate. Set the energy fields from the EV-HP time-of-use schedule.
- Watch out for: the annual discount step-up through 2031 and the demand charge phasing back in. The program page still says EV-HP eliminates demand charges; the filed schedule is where you confirm what actually applies on your in-service date.
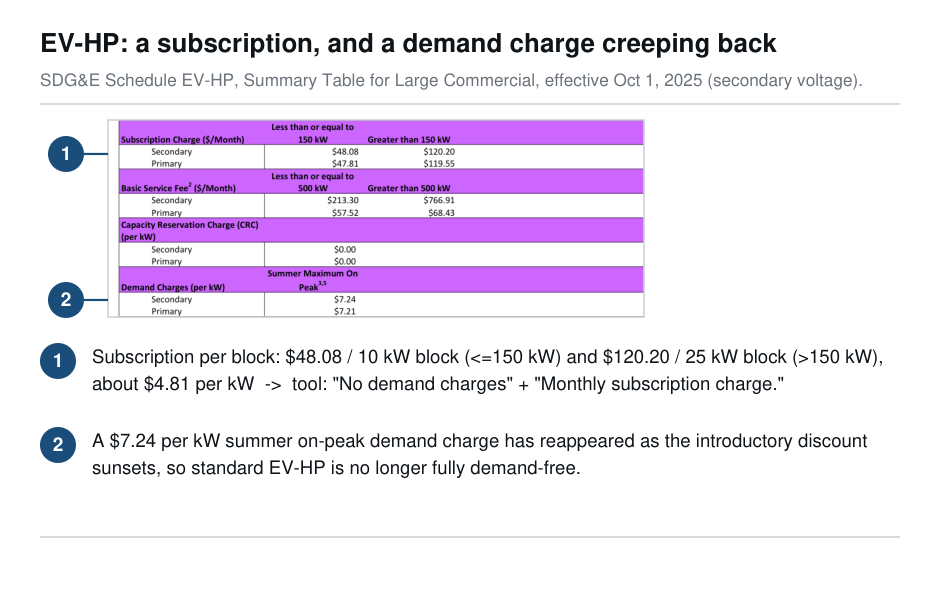
SDG&E EV-HP, read off the filed schedule. Source: SDG&E Summary Table for Large Commercial (excerpt), effective 10/1/25; CPUC A.19-07-006 / D.20-12-023.
PG&E BEV-1 / BEV-2 (subscription replaces demand)
Pacific Gas and Electric's Business EV (Schedule BEV) rate works the same way and splits by size: BEV-1 for sites at or below 100 kW (subscribe in 10 kW blocks) and BEV-2 for sites at or above 100 kW (subscribe in 50 kW blocks, no cap). The subscription replaces both the customer charge and the traditional maximum-demand charge. On the schedule effective March 1, 2026, the subscription runs $12.41 per 10 kW block on BEV-1 (about $1.24 per kW) and $95.56 per 50 kW block on BEV-2 secondary voltage (about $1.91 per kW), with an overage fee of twice the per-kW rate if your demand exceeds the level you subscribed to. The energy charge is time-of-use with peak, off-peak, and super-off-peak periods (peak is 4 to 9 p.m. every day) and, unlike most commercial rates, has no seasonal variation.
- On the sheet, look for: the subscription charge stated per block, the 100 kW line between BEV-1 and BEV-2, and the TOU energy table (no seasons). Overage is measured on 15-minute intervals, and a grace period of three billing cycles applies when you enroll or add charging equipment.
- In the tool, set: Utility tariff type to No demand charges, and enter the monthly subscription total in Monthly subscription charge (per-block price times blocks, rounding your expected peak kW up to the block size). Set energy from the BEV TOU table.
- Watch out for: picking the subscription level. The subscription is the BEV equivalent of a demand charge, so the lever that controls it is how much coincident peak your load management holds you to, not how much energy you sell.
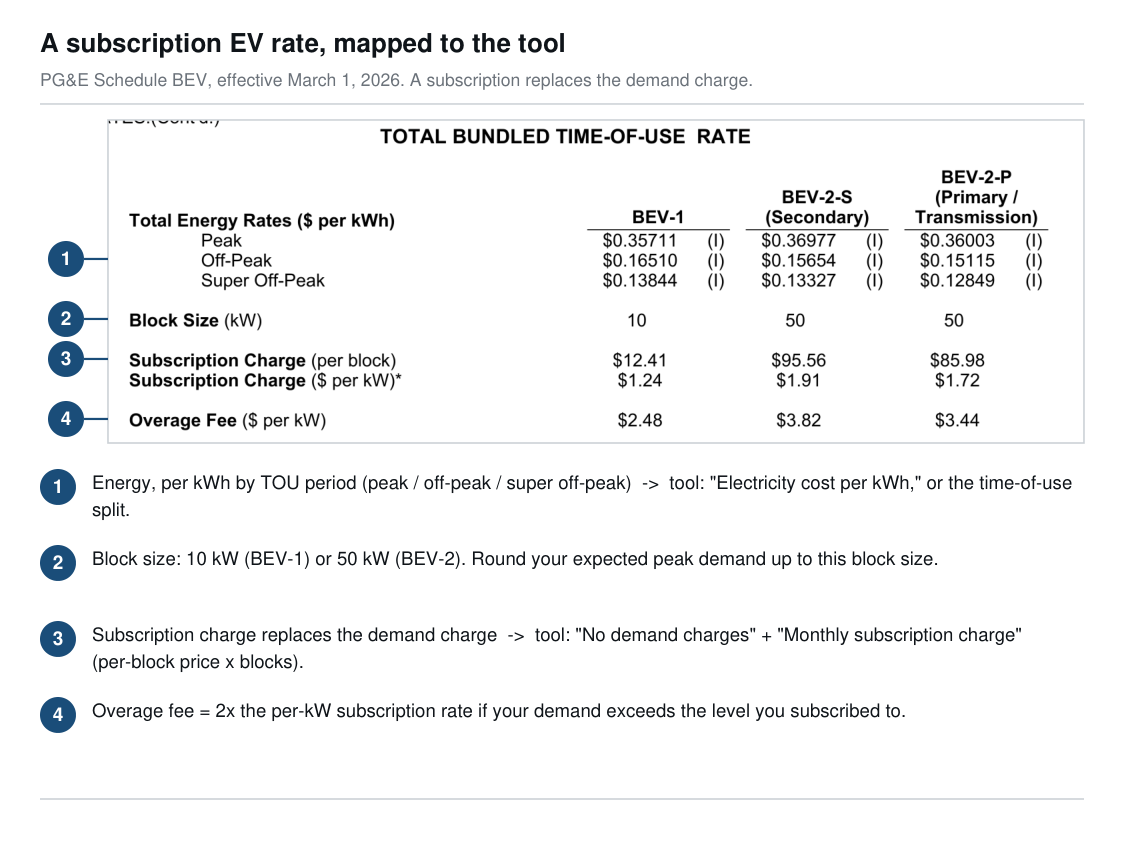
The PG&E BEV rate, mapped input by input. Source: PG&E Electric Schedule BEV, Sheet 2, effective March 1, 2026 (excerpt).
Georgia Power standard demand (a real demand charge)
The California trio all remove the demand charge, which is exactly why they do not teach what a demand charge does. For that, look at a standard commercial demand tariff with no EV-specific relief. Georgia Power's Time-of-Use General Service Demand schedule (TOU-GSD) is a clean example. As filed it carries a basic service charge of $209.00 a month, time-of-use energy charges (on-peak 12.2372 cents, shoulder 6.2514 cents, off-peak 2.3541 cents per kWh), and a real demand charge: $15.66 per kW for on-peak demand plus $5.23 per kW for maximum demand, with billed demand set by the highest 30-minute reading in the summer on-peak window (2 to 7 p.m. on weekdays, June through September). Several riders (fuel, environmental, nuclear, and a municipal franchise fee) are added on top, so confirm the current revision and adders before you model it. A site that simply takes service on the default commercial schedule pays that demand charge in full.
- On the sheet, look for: the demand-charge line in dollars per kW, separate from the energy charge, and check whether part of it applies only during on-peak hours and how billed demand is measured. Georgia's Public Service Commission bill calculator lets you cross-check the schedule.
- In the tool, set: Utility tariff type to Standard commercial tariff, enter your per-kW figure (here, $15.66 on-peak) in Demand charge (base), and set the Coincident peak factor for your number of ports. Watch the demand line move in the results; on a multi-port DC fast site it is often the largest single operating cost.
- The EV-rate tie-back: Georgia Power's Charge It, EV rider (CIEV) modifies the Power and Light commercial schedules: it multiplies your billed demand by an adjustment factor that starts at 0.20 in year one (an 80 percent reduction), steps up to 0.40, 0.60, and 0.80 over the next three years, and ends once your rolling twelve-month load factor reaches 15 percent, whichever comes first. If you model that instead of the standard schedule, the closest tool setting is Demand-charge holiday (phases in later), with the caveat that CIEV starts at an 80 percent reduction rather than a full waiver. This is the general shape of EV-specific relief: suppress the demand charge while utilization is low, and bring it back as the site fills.
A closing note on why all of this needs a current sheet: Duke Energy Carolinas, to take one example, raised its commercial demand charges in three annual steps from 2024 through 2026 and has another increase pending for 2027. A demand figure that was right two years ago is wrong today. The mechanism is stable; the numbers are not.
The snapshot is a decision tool, not a billing engine. It blends a tariff into a credible payback in seconds, but it deliberately leaves out several real-world wrinkles. Know them so you do not over-trust a clean-looking result:
- Partial-peak and multi-tier energy. The time-of-use option blends an off-peak and a peak rate. If your tariff has a distinct part-peak or super-off-peak tier that carries a lot of your energy, compute a blended rate by hand and enter that.
- Seasonal rates. The tool uses one energy rate and one demand rate. If summer and winter differ sharply, run the summer case as your stress test, since that is usually when both energy and demand bite hardest.
- Demand ratchets and time-of-use demand windows. The tool charges demand on your modeled coincident peak. It does not model a twelve-month ratchet or a separate on-peak-only demand charge. If your tariff has either, your real demand bill can exceed the tool's estimate; treat the tool's demand line as a floor.
- Subscription step-ups and overages. The subscription field is a flat monthly figure. It does not auto-escalate with a discount sunset (SDG&E) or model an overage bump if you under-subscribe. Re-run future years with the higher subscription if your rate steps up.
- The schedule changes. Tariffs are refiled constantly through rate cases and advice letters. Confirm the schedule that will be in effect when your site energizes, not the one in effect when you modeled it, and recheck before you sign.
When in doubt, ask your utility's commercial or EV-program team for the rate schedule that applies to your service size and voltage, and have them confirm the demand treatment in writing. The tariff sheet is the most valuable page in your whole project file. It is worth reading slowly.
If you have not built the rest of the model yet, start with Building a Realistic ROI Model for Level 2 sites or DC Fast Charging ROI for fast charging, check your state page for the named utility EV rates in your territory, and see Federal EV Charging Funding for the grant programs that change the capital side of the same model.
Last factually verified: 2026-06-19 against the utilities' filed schedules and rate materials: PG&E Schedule BEV (energy and subscription rates effective March 1, 2026), the SCE TOU-EV-7/8/9 rate fact sheet, SDG&E EV-HP (Schedule EV-HP summary table effective October 1, 2025; CPUC Application A.19-07-006, Decision D.20-12-023), Georgia Power TOU-GSD and the CIEV rider, the Georgia PSC bill calculator, and Duke Energy Carolinas North Carolina rate-case filings. The Georgia Power figures are read from the filed TOU-GSD schedule, which carries rider adders on top of the printed rates, so check them against the current revision. Dollar figures illustrate each rate's mechanism and move through rate cases and advice letters, so read the figures that apply to your service size, voltage, and in-service date off your utility's current filed schedule before relying on them.